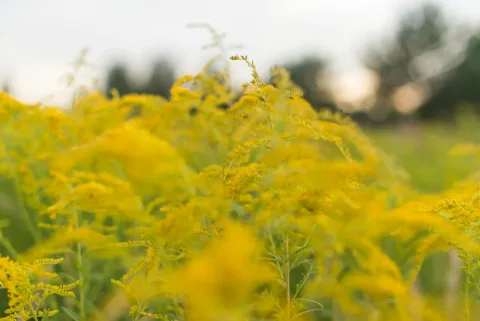

The pollen species article covers a handful of headline genera: alder, birch, grass, mugwort, olive, ragweed. Useful summary but missing important regional dominants. For users in specific regions, tree pollens not on that short list often produce the dominant springtime allergen exposure.
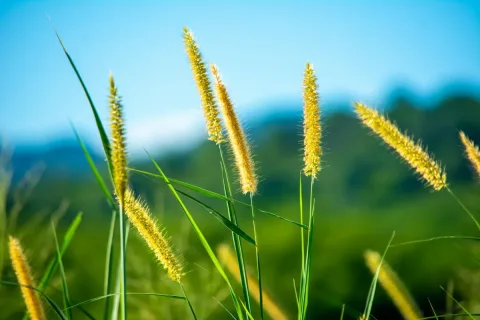
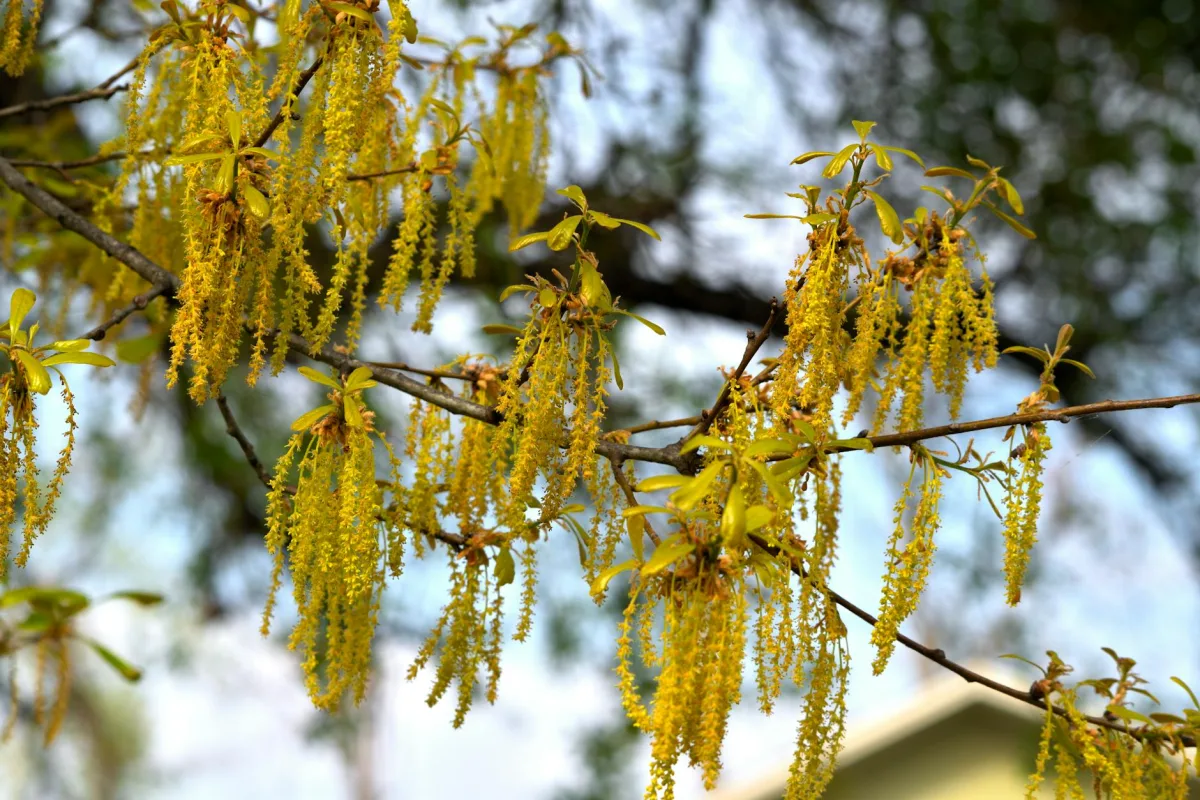
Oak dominates the southeastern US from March through May. Oak pollen counts during peak weeks can exceed 1,000 grains/m³, among the highest tree-pollen burdens in the country. Mountain cedar (Juniperus ashei) dominates central Texas from December through February; "cedar fever" is the regional name for the resulting allergic response. Maple dominates the Northeast and Great Lakes from March through May; red maple specifically is one of the earliest-blooming species. Birch dominates the Northeast and southern Canada from April through May.
Elm blooms early (February to April) across most of the U.S. and is one of the first allergens after winter in many regions. Cottonwood and poplar follow in spring, particularly in the West. Mulberry dominates in the desert Southwest. Pine produces visible yellow pollen but is generally less allergenic than expected per gram, though the visual impact is substantial. The AAAAI maintains detailed regional pollen guides.
The Google Pollen API that feeds the dashboard does break out specific plant species, not just the broad tree, grass and weed indices, so the dashboard can show per-species pollen where the data exists: oak, birch, cedar, ragweed and others. That means users in regions where oak or cedar or maple dominates can see the species that actually drives their exposure rather than a generic "tree" figure. Climate change is shifting these patterns; see seasonal IAQ shifts.
References
- AAAAI - Pollen allergy guide www.aaaai.org
- Pollen.com - National allergy forecast pollen.com
- EPA - Climate change indicators: ragweed pollen season www.epa.gov
- Open-Meteo - Air Quality API documentation open-meteo.com