
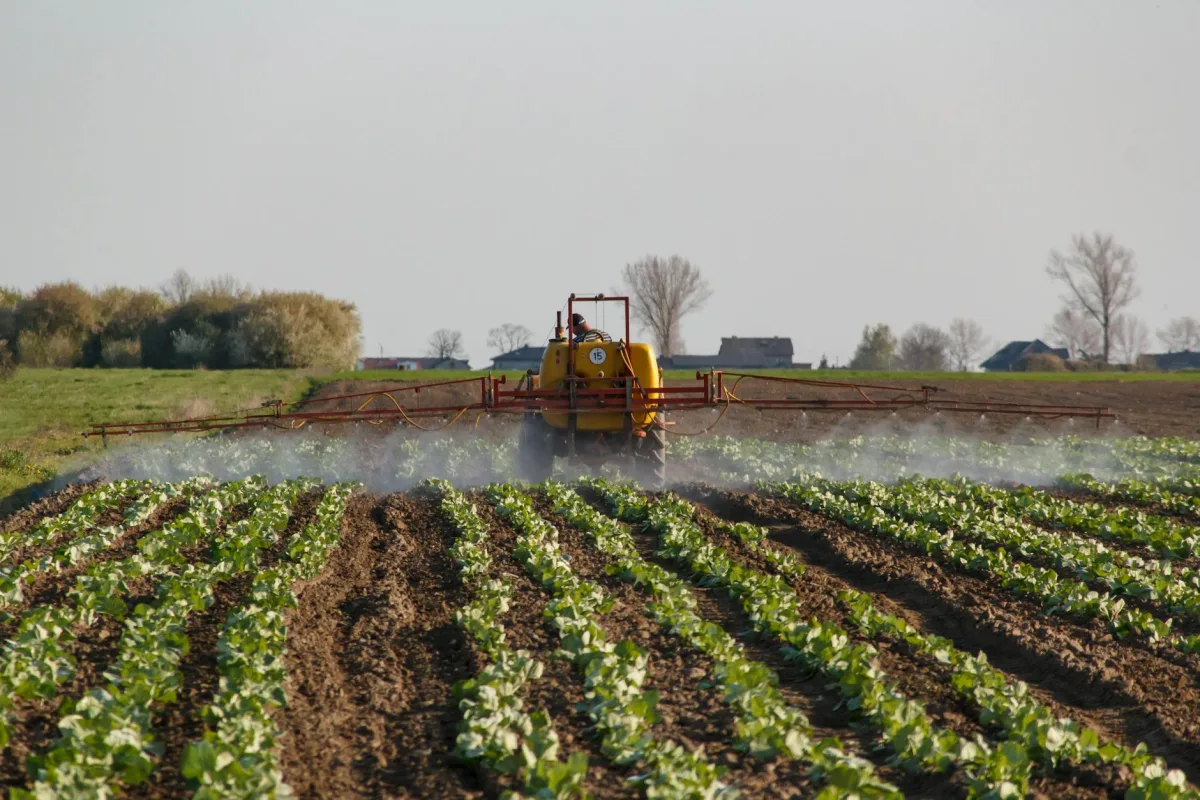
For rural residents and the suburban edge of farming country, pesticide drift is a recurring IAQ event. The compounds most commonly involved in documented drift incidents are glyphosate (Roundup and related products), 2,4-D (a broadleaf herbicide), and dicamba (whose 2017 drift incidents across the US Midwest damaged millions of acres of non-target soybeans and became a federal regulatory case study). Aerial application produces the largest drift distances (one to several miles under unfavorable wind conditions); ground application from boom sprayers stays closer but is still measurable hundreds of meters downwind.
Drift distance scales with droplet size and wind. Smaller droplets ride the wind farther; lighter winds and temperature inversions trap drift close to the ground at human breathing height. EPA drift-reduction guidance and the Worker Protection Standard (40 CFR 170) establish buffer zones for occupied structures, but the buffers are calibrated for occupational protection of farmworkers, not for chronic low-dose exposure of nearby residents. State-by-state regulations layer on top; California, Washington, and Minnesota have notably stricter drift rules than the federal floor.
Symptoms downwind of active spraying include eye and throat irritation, headache, and asthma exacerbation, typically within minutes to hours of exposure. The dashboard's role: the VOC index sometimes flags drift events (many pesticide formulations include high-VOC carrier solvents that the SEN66's VOC channel responds to), and PM2.5 can spike during and after aerial application from the carrier-droplet and dust components. Neither is a specific pesticide measurement; both are useful for catching that something changed in the outdoor air at a time and shape consistent with a known regional spraying window. USDA ARS publishes drift-modeling research that maps which crops and regions get sprayed when.
For residents in agricultural areas, the playbook overlaps the wildfire-smoke playbook. Track regional spraying forecasts where available (some states publish them; WHO background is useful for context). Close windows during forecast operations, especially during morning and evening temperature inversions when drift settles. Upgrade HVAC to MERV-13 minimum; activated-carbon supplemental filtration helps for the VOC-carrier component. Time outdoor activities and ventilation for after sundown on spray days. See ammonia and agriculture for the related rural-air issue, outdoor air feeds for the data-source side, and envelope sealing for the building-side response.
References
- EPA - Reducing pesticide drift www.epa.gov
- EPA - Agricultural Worker Protection Standard www.epa.gov
- WHO - Pesticide residues fact sheet www.who.int
- USDA ARS - Pesticide drift research www.ars.usda.gov