

Le calcul est simple. Pour tout polluant que l'appareil lit à l'intérieur et que le flux extérieur rapporte pour votre emplacement, divisez l'intérieur par l'extérieur sur la même fenêtre temporelle. Une moyenne sur 24 heures est la meilleure pour les questions de base sur l'enveloppe ; une moyenne sur 1 heure est meilleure pour les événements actifs comme une poussée de fumée de feu de forêt ou un après-midi d'ozone. Le ratio est sans unité, et c'est tout l'intérêt : il retire l'échelle absolue de l'événement et isole ce que votre bâtiment fait à son propos.
Bandes typiques pour les PM2,5, l'espèce la plus diagnostique. Sous 0,3 signifie une enveloppe étanche avec filtration active : HEPA en marche, MERV-13 dans le CVCA, portes et fenêtres fermées, aucune source intérieure significative. 0,3 à 0,6 est modéré : soit une enveloppe correcte sans HEPA portatif, soit un CVCA fonctionnant avec son filtre d'origine et infiltration normale. 0,6 à 0,9 indique des fenêtres entrouvertes ou une maison plus ancienne perméable sans appui de filtration. Près de 1,0 signifie que les fenêtres sont ouvertes, ou que l'enveloppe est si perméable qu'elles pourraient l'être. Au-dessus de 1,0 est le cas alarmant : la concentration intérieure dépasse l'extérieure, ce qui signifie qu'il y a une source à l'intérieur. Enquêtez.
Les subtilités par polluant comptent. Les ratios PM sont les plus propres parce que les particules ne se transforment pas chimiquement entre l'extérieur et l'intérieur. L'ozone est différent : les ratios intérieur/extérieur d'ozone typiques se situent à 0,2 à 0,4 même fenêtres fermées, parce que l'ozone réagit avec les surfaces intérieures (peau, tissus, peinture) en quelques minutes. Le CO2 inverse tout le cadre : l'extérieur est près de 420 ppm et l'intérieur est presque toujours plus élevé parce que les gens expirent ; la question diagnostique pour le CO2 est « de combien plus élevé que l'extérieur », pas « quel ratio ». Les ratios NO2 sont dominés par la combustion intérieure (cuisinières au gaz) lorsque présente ; sans source intérieure, le ratio tourne à environ 0,5 à 0,8 dans les maisons près du trafic.
Limites à garder en tête. Le ratio suppose que les deux lectures sont valides ; un capteur dérivant, un comptage PM confus par l'humidité, ou un flux extérieur périmé briseront tout. Le moniteur extérieur le plus proche peut être à 5 à 30 km, donc lors d'un événement hyperlocal le ratio peut induire en erreur. Et les fenêtres de moyennage courtes sont bruyantes : un seul camion qui passe ou une bougie d'une minute peut faire osciller dramatiquement le ratio sur 5 minutes. Utilisez le ratio comme signal lent, moyennez sur des heures, et appariez-le aux patrons de co-mouvement pour confirmer ce qui pilote le chiffre.
Intelligence Terrestream · près de chez vous
Ce qu'un Terrestream signalerait aujourd'hui à Columbus, OH
Situation
Intrusion de fumée extérieure
Conditions d'avis de fumée · AQI 50 · PM2.5 7 µg/m³ · près de Columbus, OH
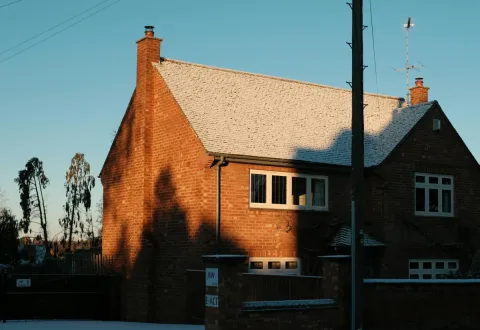
De la fumée de feux de forêt atteint vraisemblablement votre secteur. Dans une maison comme celle-ci, un Terrestream signalerait la montée des particules fines à l'intérieur et recommanderait de fermer et de filtrer — puis continuerait de vérifier que l'air intérieur reste plus propre qu'à l'extérieur.
- PM2,5 (intérieur) 12 µg/m³ Moderate
- CO₂ (intérieur) 640 ppm Moderate
Action recommandée Maintenant
Fermer et filtrer
- Fermer les fenêtres
- Faire tourner un purificateur
Gardez portes et fenêtres fermées, faites tourner un purificateur et évitez d'ajouter des particules à l'intérieur (friture, chandelles, aspirateur). L'objectif : maintenir les PM intérieures sous les niveaux extérieurs.
Pour les consignes de santé et toute directive de confinement ou d'évacuation, suivez les avis officiels sur la qualité de l'air et vos autorités locales.
Illustration : les conditions extérieures sont des données réelles, approximatives pour votre secteur; les valeurs intérieures sont modélisées, non mesurées. Aucun appareil ne transmet depuis votre domicile. Ceci n'est pas un avis médical.
Références
- ASHRAE norme 62.2 - Ventilation résidentielle www.ashrae.org
- LBNL - Publications sur l'enveloppe du bâtiment buildings.lbl.gov
- DOE - Weatherization Assistance Program www.energy.gov
- EPA - Notions de base sur la qualité de l'air intérieur www.epa.gov