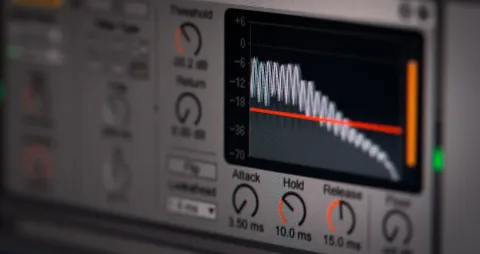

Sensor faults are usually obvious once you know the catalog. The four patterns to recognize: (a) stuck-at-rail, where a channel sits at exactly zero or exactly its maximum for an extended period (offline or saturated); (b) sudden step change, where a value jumps to a new level without any real-world cause (a reset, a move, a firmware update); (c) impossible value, like negative humidity, 200°C temperature, RH sustained above 100%, or pressure outside the BMP390L's 300-1250 hPa range; (d) uncorrelated drift, where one channel slowly walks away from everything else over hours with no environmental driver. The dashboard runs these checks continuously.
When a fault pattern is detected, the dashboard does three things automatically. It flags the affected sample with a "questionable" marker on the sparkline. It excludes the flagged samples from the rolling 1-hour and 24-hour averages so a stuck channel cannot drag your trend line. And it surfaces the event in the device maintenance view, which is where you should look first if the dashboard looks "off." See how anomaly detection works for the related (but distinct) case where the data is real but the pattern is unfamiliar.
When you see a flagged reading, the user-side checks are short. Reality-check: is the room actually different right now in a way that would explain the value, or does the air feel normal? Placement-check: has the device been moved, bumped, or power-cycled in the last hour? Restart and recalibrate: a reboot resolves most transient faults; for the SEN66's CO2 autocalibration, exposing the device to outdoor air for roughly 30 minutes resets its baseline; the VOC and NOx indices auto-baseline over their first day of use. Contact support if a fault repeats after a clean reboot, or if a channel stays at-rail for more than an hour.
The AI follows one rule when data is flagged: do not recommend an intervention based on a suspect reading. Instead of "your CO2 is 2,000 ppm, open a window," a flagged sample produces "this CO2 reading looks unreliable (suspected sensor glitch), wait for the next clean sample before acting." The distinction between a real spike and a glitch comes down to shape and corroboration: real events have a rise, a peak, and a decay that match a known fingerprint, and they usually move more than one channel (cooking moves PM and VOC together; a shower moves RH and temperature together); glitches are vertical, single-channel, and have no plausible driver. See where the numbers come from for the full pipeline behind every value on the dashboard.
References
- NIST - Indoor air quality sensors www.nist.gov
- Sensirion - SEN66 product catalog sensirion.com
- EPA - Air Sensor Toolbox www.epa.gov
- ASHRAE - Indoor Air Quality Guide www.ashrae.org