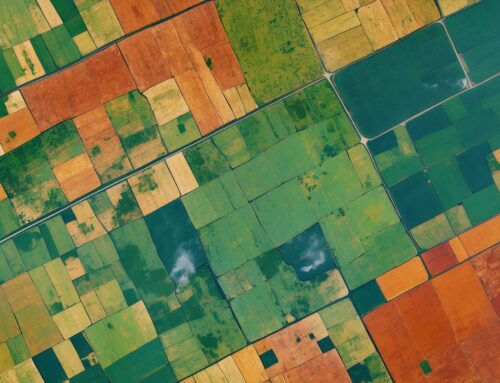
The 7-day soil moisture depth time series chart, located at the bottom right portion of the dashboard, offers a unique and insightful perspective on soil moisture dynamics. This chart visualizes how soil moisture levels change over time at different depths, providing a detailed understanding of how irrigation practices and environmental factors influence moisture throughout the soil profile. By combining a 3D model with color coding, this visualization makes it easier for farmers to interpret and act on complex soil moisture data.
An In-Depth Look at Soil Moisture Changes Over Time
The 7-day soil moisture depth chart is more than just a time series plot—it’s an interactive 3D model that provides a comprehensive view of soil moisture changes across different layers of the soil. This visualization is especially valuable for understanding how quickly moisture reaches specific depths, which is critical for the effective management of crops with deep root systems. The model helps answer important questions like: “How long does it take for moisture to penetrate down to the root zone?” and “Is irrigation reaching the deeper layers effectively?”
How to Understand the 3D Visualization
This 3D chart can initially seem complex, but understanding it is key to making informed irrigation decisions. The visualization utilizes three axes:
- The X-axis represents time, showing a 7-day period that helps track changes in soil moisture over a week.
- The Y-axis represents depth, measured in inches. This axis allows farmers to see how moisture levels vary at different depths, such as 12, 24, 36, and 48 inches.
- The Z-axis represents soil moisture percentage, indicating the level of moisture present at each depth over time. Additionally, this is color coded for ease of interpretation—with colors ranging from blue (indicating high moisture) to red (indicating low moisture).
By combining these three dimensions, the model creates a visual representation that allows farmers to see moisture distribution not only at the surface but throughout the entire soil profile. This level of detail is especially important for crops that require consistent moisture at deeper levels, such as fruit trees or perennial grasses.
The Importance of Soil Moisture Depth Insights
Understanding soil moisture dynamics across different depths is crucial for effective irrigation management, especially when dealing with crops that have deep roots. Traditional soil moisture measurements often focus on surface levels, which may not provide a full picture of the moisture available to deeper root zones. With this 7-day time series depth chart, farmers can:
- Assess Moisture Penetration: Determine whether irrigation efforts are reaching deep enough into the soil to provide adequate moisture for all layers of the root zone.
- Optimize Irrigation Schedules: Adjust irrigation timing and volume to ensure that the entire root system—from shallow to deep—receives adequate water, minimizing water waste and promoting healthy crop growth.
- Identify Water Movement Delays: Visualize how long it takes for moisture to move downward after irrigation, helping farmers adjust irrigation schedules accordingly to avoid issues like over-irrigation or shallow watering.
The ability to interactively explore moisture levels by depth is particularly useful for dealing with changing field conditions. If there are unexpected dry layers deeper in the soil, farmers can take immediate action to address these issues before they impact crop health.
A Unique Approach to Visualizing Soil Moisture Data
The 3D nature of this chart sets it apart from traditional soil moisture visualizations, which often present data in a simple two-dimensional format. By adding depth and color coding, this chart transforms complex data into an easy-to-interpret, interactive visual experience. The ability to rotate and explore the model allows farmers to observe trends from different angles and gain a more holistic understanding of how their irrigation strategy impacts different soil depths.
This type of visualization is especially helpful for growers who need to balance moisture at multiple depths—ensuring that moisture reaches the lower root zones without over-saturating the upper soil layers. The color-coded insights make it easy to spot trends and identify problem areas at a glance, saving valuable time and guiding precise interventions.
Conclusion: A Valuable Tool for Precision Irrigation
The 7-day soil moisture depth time series chart is an innovative tool that helps farmers go beyond surface-level understanding of soil moisture. By providing a fully interactive 3D view of how moisture moves through the soil profile over time, it empowers farmers to make informed, data-driven decisions about irrigation. With this visualization, farmers can optimize irrigation schedules to ensure that water reaches every part of the root zone, improving crop health, yield, and resource efficiency.

