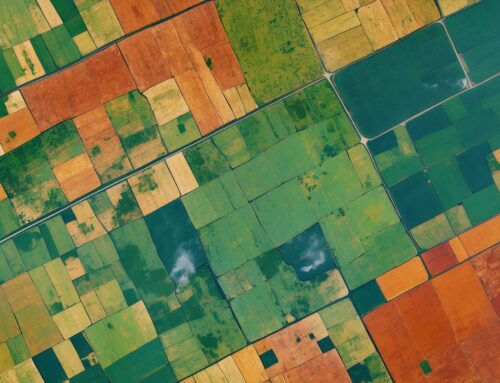
One of the most powerful and innovative features of the farm management dashboard is the 3D Soil Moisture Model, located in the top right section of the interface. This interactive visualization offers a highly detailed and informative look at soil moisture levels across the farm. By providing insights into moisture distribution at different depths and across various locations, this model empowers farmers to make well-informed irrigation decisions that enhance crop health and resource efficiency.
An In-Depth Look at the 3D Soil Moisture Model
The 3D Soil Moisture Model is color-coded to indicate areas with appropriate moisture levels, overwatering, and underwatering. This immediate visual representation helps farmers quickly determine if their irrigation practices are effective or if adjustments are necessary. For example, areas in blue and green typically represent optimal moisture levels, while red signals potential overwatering, and yellow indicates areas approaching the wilting point. By providing a clear and fast estimate of field capacity, farmers can immediately identify which parts of their land need more or less water, allowing for swift action to optimize irrigation.
This interactive model can be rotated and viewed from different angles, making it easier to visualize moisture conditions at various depths and across the entire farm. The system organizes the sensors by their physical locations, providing farmers with a comprehensive view of moisture distribution throughout the fields. Farmers can also customize the color coding of the 3D model, creating a personalized visualization that best fits their specific requirements or preferences. This level of interaction allows farmers to tailor the data presentation to their needs, making it easier to focus on the most critical areas.
Historical and Predictive Insights at a Glance
Another key feature of the 3D model is the ability to cycle backward in time to see how soil moisture levels have changed over the past several days. By using this feature, farmers can gain insights into how their fields responded to recent irrigation efforts or weather events, such as heavy rainfall or drought conditions. This historical perspective allows them to refine irrigation practices and make data-driven adjustments to their approach.
The model doesn’t just provide a snapshot of the past or present—it also offers predictive insights for the future. By incorporating historical data, weather forecasts, and even climate change models, the dashboard can simulate how soil moisture levels are expected to change over the coming days. This forward-looking capability helps farmers make proactive decisions, such as increasing irrigation ahead of a dry spell or holding back when rain is forecasted.
A Unique and Innovative Tool for Farm Management
The 3D Soil Moisture Model sets our farm management dashboard apart from other systems on the market. This level of interactive, three-dimensional visualization is rarely offered by competing dashboards, making it a truly innovative tool for farmers. By providing a comprehensive, real-time view of soil moisture distribution, the model offers tremendous value that goes beyond traditional two-dimensional graphs and tables.
Many soil moisture monitoring solutions provide static or basic visualizations, but our 3D model allows farmers to interact with their data in new ways—rotating, zooming, and changing color schemes to highlight areas of interest. The ability to both look back at historical data and predict future moisture levels is a game-changer for proactive irrigation management. Farmers can now base their decisions not only on current conditions but also on anticipated changes, which leads to more efficient water use and healthier crops.
This unique offering is a testament to our expertise and investment in AI and machine learning, along with cutting-edge visualization techniques. By leveraging advanced technologies, we provide farmers with an unprecedented level of insight into their fields, allowing them to make data-driven decisions with confidence.
By offering this innovative visualization, we give farmers the tools they need to make more informed decisions, reduce waste, and maximize productivity. The combination of interactive features, predictive analytics, and the ability to customize views provides a level of insight that is unmatched by other dashboards.
A User-Friendly, Actionable Tool for Farmers
The 3D Soil Moisture Model is designed to be highly user-friendly and actionable. The ability to rotate the model, adjust color coding, and view past and future moisture levels means farmers can easily identify problem areas and take corrective actions. The comprehensive visual representation of moisture levels at a glance helps farmers reduce the risk of overwatering or underwatering, conserve resources, and ultimately enhance crop productivity.
By integrating advanced predictive analytics, interactive features, and customizable visualizations, the 3D Soil Moisture Model provides a holistic, in-depth understanding of field conditions. It helps farmers get the most out of their resources, ensuring that water is applied where and when it is needed most, optimizing yields while minimizing waste.

